Orthophotography and orthomosaics
- a világ madártávlatból
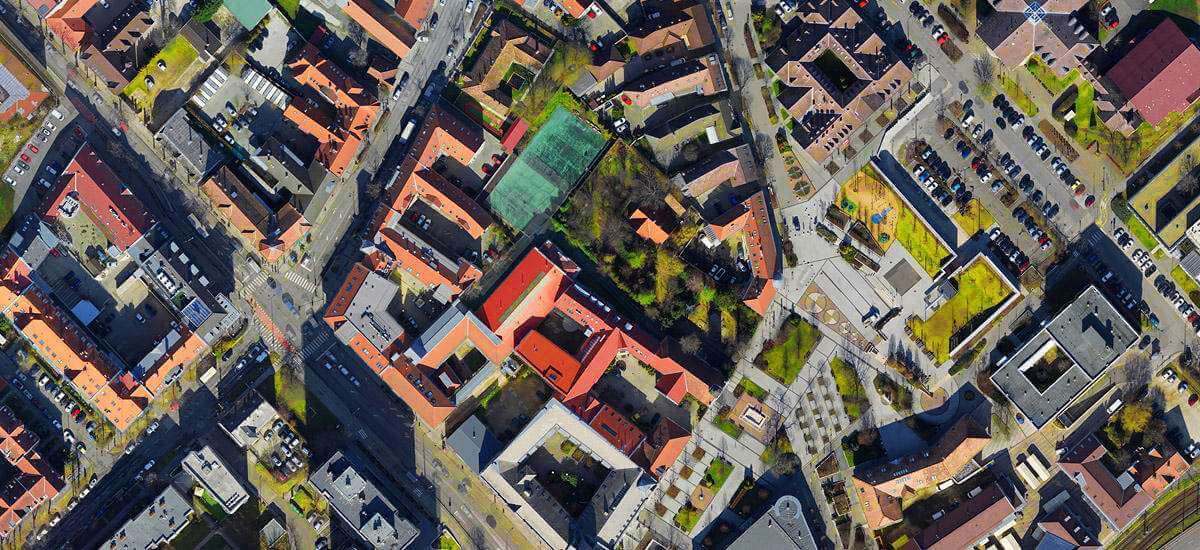
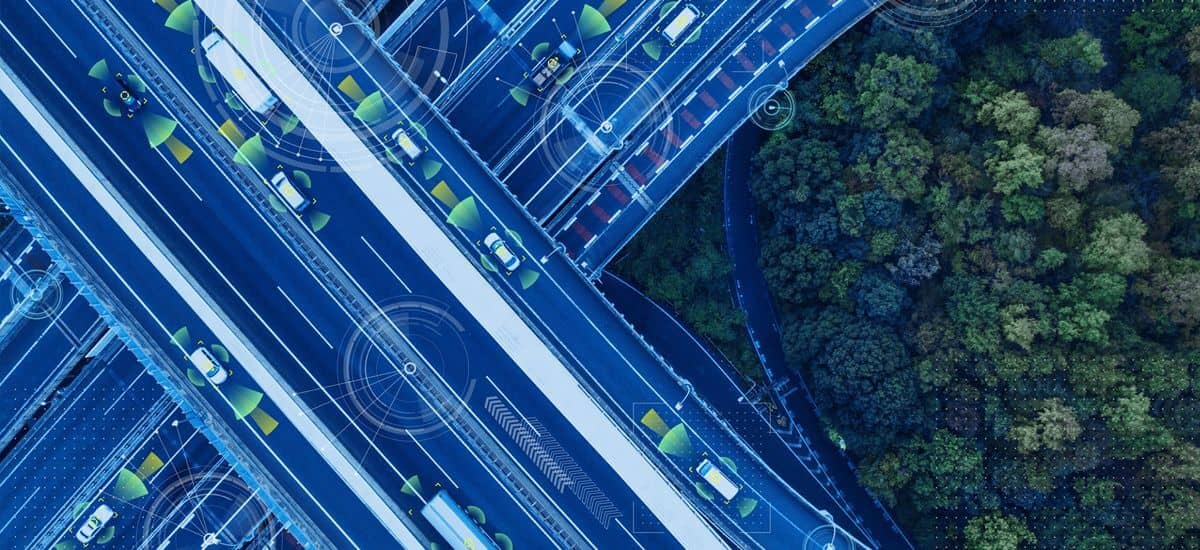
An orthophoto is an aerial photograph that is completely free of perspective distortion. Our surveys are conducted with a lateral overlap of 78% and a longitudinal overlap of 82% - so there is no point in the area that is not included in at least 10 independent photographs (whereas in traditional large-format aerial photography, where the lateral overlap is 15-25%, several points are included in only 2 images, making it impossible to orthorectify).
As a result, all points in the images are seen in full top view. This is how the true orthophoto, the "True Ortho", can be achieved.
In simpler terms, an orthophoto is an aerial view of the ground, with a perspective always perpendicular (angle of 90 degrees) to the ground.
An orthophoto mosaic, also known as an orthomosaic, is nothing more than a series of orthophotos stitched together based on their precise geolocation with a suitable overlap.
Our georeferenced and geometrically accurate (distortion-free) orthophotos are the basis for modern urban planning and management systems and planning tasks. It also provides effective support in the areas of planning authorities, land administration and urban development.
Possible output data:
geotiff, GeoJPG, ECV, MRSID, kmz, kml, GeoPackage
Some of our references:
63-as út Sárbogárd
Road 63 Sárbogárd
Borota settlement survey
Bosch industrial park
Sárbota
Sárbor Egor road
Bridge in Győr
KFKI site
M1 road
M30 road
M35 road
M4 road
M44 road
M76 road
M8 road
M9 road
M85 road
M85 road Archaeology
Paks Bridge
Pázmánd
R67 road
Zsámbék Church
Budaörs Hegyalja út
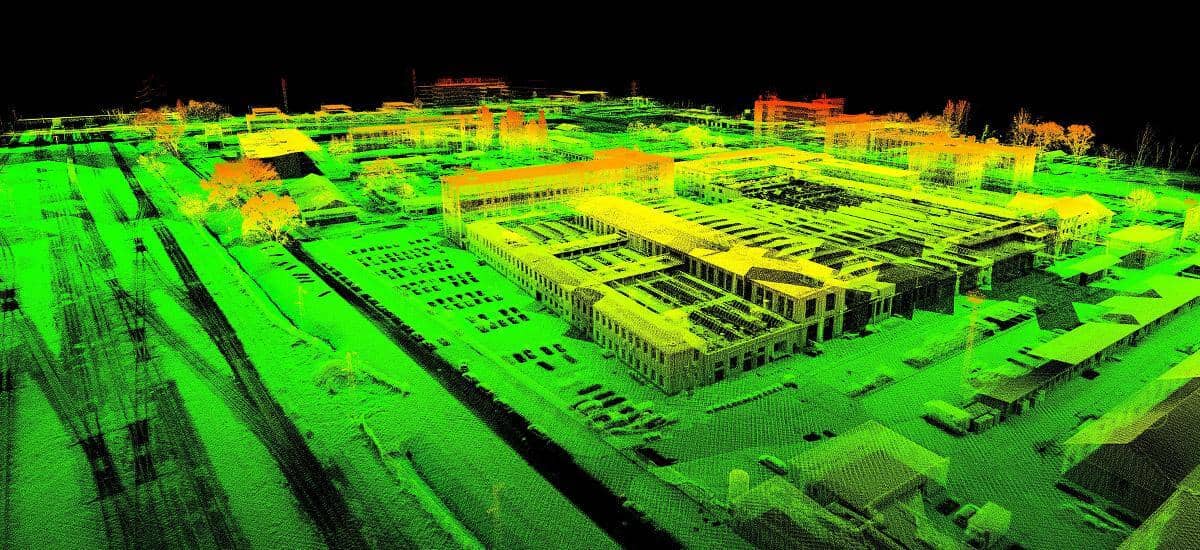
Point cloud and point cloud vectorisation
- LIDAR (laser scanner) survey.
Accurate, classified and cleaned elevation model: 100 measured points/m2.
Suitable for capturing the ground under vegetation.
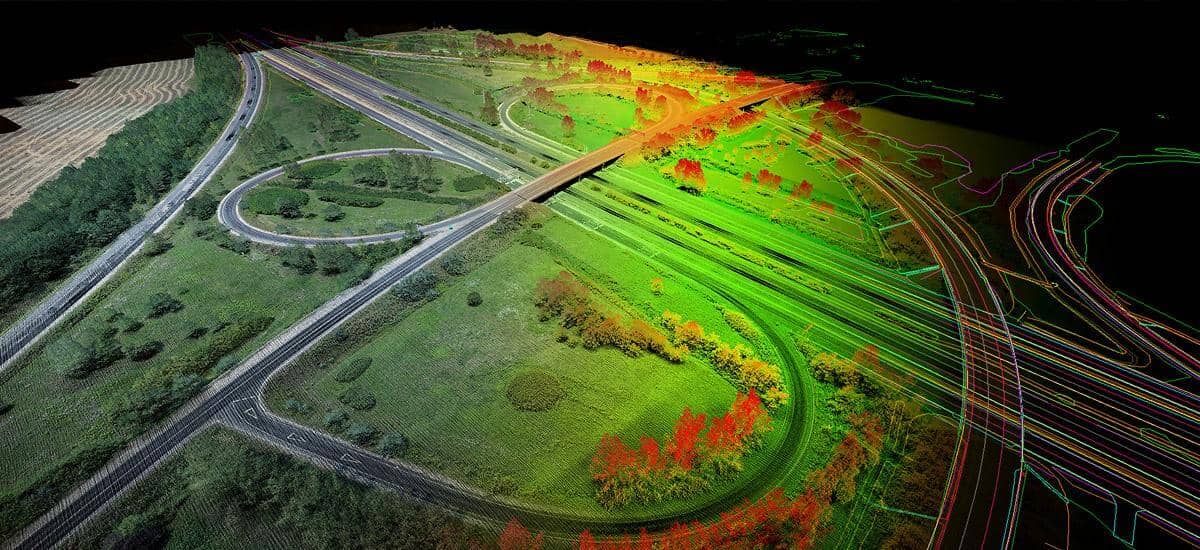
The point cloud is defined as the set of points measured by the laser scanner.
Based on our LIDAR survey, we can provide a resolution of at least 100 measured points/m2 - this means that even in a heavily forested area, about 10 points/m2 are reflected from the ground, so we can practically "see" under the vegetation. This allows us to generate an accurate, classified and cleaned topography model.
These data/point clouds become valuable information during our classification process, when we use our added expertise to evaluate and classify them by object, and produce vector three-dimensional files of the point clouds that can be manipulated by CAD programs. This is where point clouds really make sense. The main advantage of this is that we can visualise the completed project or the one under construction in a real 3D environment.
Possible output data:
LAS, LAZ, XYZ, DWG, DNG, GeoPackage
Some of our references:
Bosch Industrial Park
Győr Bridge
M1 road
M76 road
M9 road
M85 road
Paksi bridge - Danube
Zsámbék Church
Budaörs Hegyalja road
Shipyard Island
M43 road, Makó
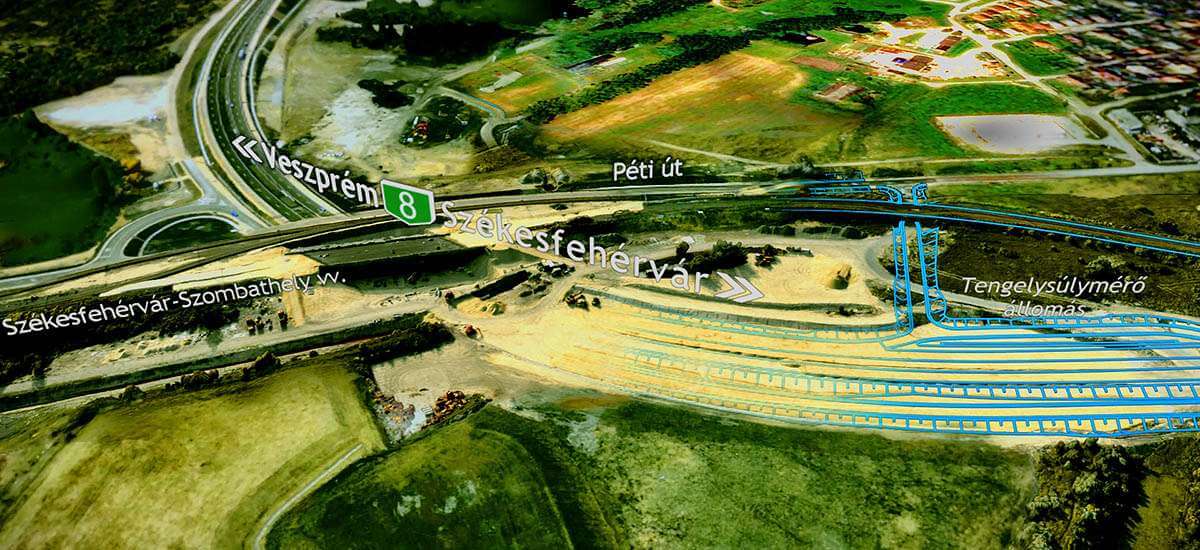
Highway 8 Székesfehérvár bypass
Digital surface model and elevation model
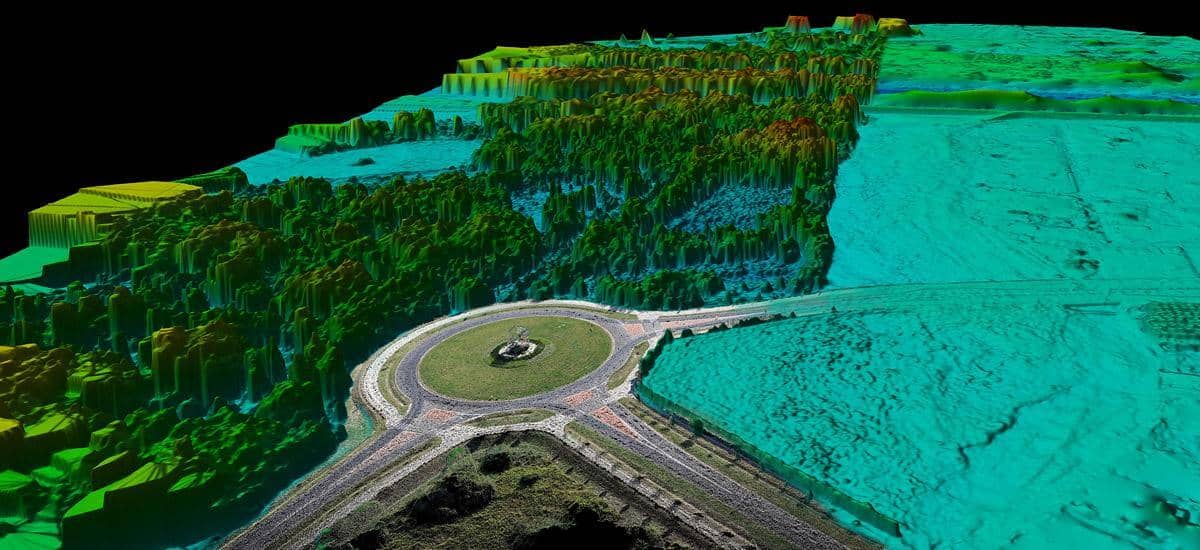
- The Digital Surface and Topography Model is a three-dimensional model created with two different technologies, RGB camera based photogrammetry and/or Lidar scanner, which is suitable for precise calculations and measurements, as well as for modelling the area covered.
Digital elevation and terrain models are indispensable in modern planning processes. Our terrain and surface models represent the existing environment conditions with scale and positional accuracy, providing the basic data describing the topography and surface conditions required for design.
The biggest advantage of calculating volumes based on digital terrain model (DTM), coming from RGB camera images obtained by aerial triangulation or Lidar (laser scanner), is that it contains orders of magnitude more datapoints than traditional ground survey methods. It also tracks the actual surfaces with minimal interpolation, so the results of different measurements will be more accurate, with a reduced margin of error.
The digital terrain model (DTM) can be created using a laser scanner, which has the unique feature of being able to penetrate through the leaves of trees/shrubs, allowing us to see virtually under the vegetation. In the Lidar surface models, we also use the laser beams to capture the real terrain surface underneath the canopy, so that by removing the vegetation we can also measure the real topography, which is displayed in three dimensions.
In contrast, the Digital Surface Model (DSM) is a three-dimensional model that represents the top of the surfaces with the highest local elevation of vegetation and the built environment.
Possible output data:
GEOTIFF, ASCII, XYZ, CSV, LAS, GeoPackage
Some of our references:
Eger wine region
Győr Bridge
KFKI - Location
M4 road
M44 road
M76 road
M85 road
M85 road, Archaeology
R67 road
Zsámbék Church
Budaörs Hegyalja út
Level contour map above and below the water surface
- Maps with accurate elevation/depth information: expresses elevation differences, topography, degree of slope and its direction.
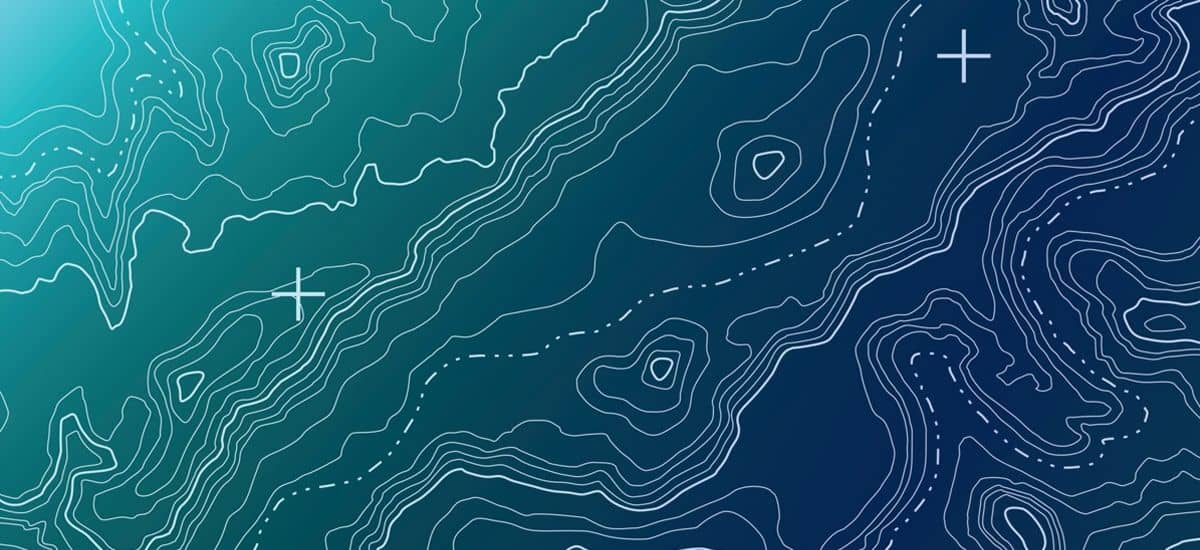
A contour map is a vector line connecting landmarks of the same elevation on the surface, generated from elevation models, coming either from above or below the water surface.
A contour map provides simple but accurate elevation/depth information for the area of interest.
It has the advantage of being quite small in file size, so it can be easily displayed on almost any computer. In addition to displaying relief, it expresses differences in elevation, the shape of landforms and the degree and direction of slope.
Possible output data:
DWG, DXF, DGN, SHP, GeoPackage
Some of our references:
Road 63 Sárbogárd
Sárbogor, Sárgogórské Sárbogor
Gyuró
M85 Archaeology
Budaörs Hegyalja út
Paksi Bridge
HD map
- An essential part of autonomous vehicle navigation systems
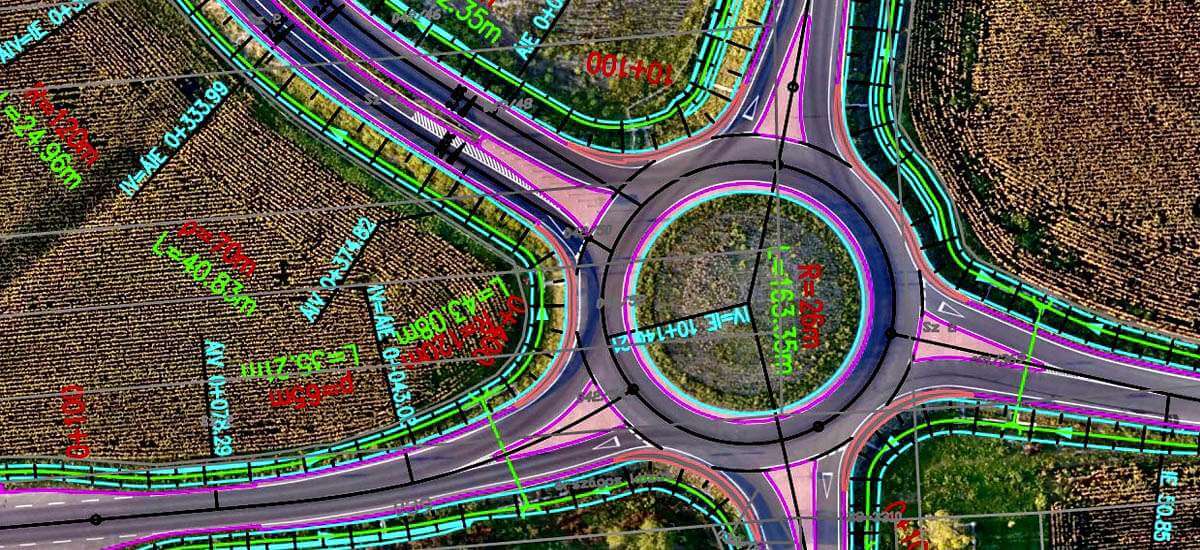
HD map is an essential pillar for the perfect and safe operation of autonomous vehicles.
We digitise the area we record and produce all relevant information - such as traffic order, horizontal and vertical traffic signals (traffic signs and panels), road restraint systems, geometric designs - in a cm-accurate digital base map system that is readable for autonomous vehicles.
In addition to the use of autonomous vehicles, HD Map allows us to model traffic situations in a simulated environment.
Possible output data:
open drive (XODR), visualization in Carla, GeoPackage
Some of our references:
ZalaZone Smart City
Heat map
- Display the invisible
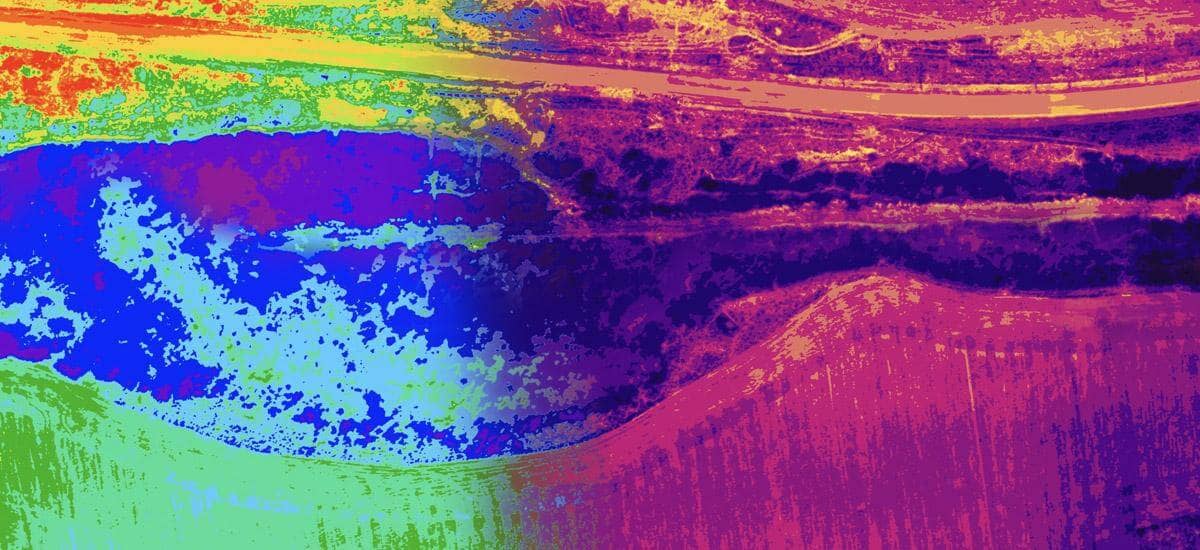
The heat map, also known as temperature-coloured map, visualises the temperature data of remotely sensed objects or areas up to tenths of a degree.
This allows us to monitor the efficiency and/or (in)proper functioning of several different energy installations - solar parks, high-voltage power lines - with the help of our thermal imaging sensors. The survey is followed by an evaluation: we can clearly identify where a power line is overheating, where a solar panel is not performing well, where the ground water level is high.
Thanks to the fast, efficient and clear identification, faults and potential hazards can be quickly corrected or elliminated.
Possible output data:
geotiff, GeoJPG, ECV, MRSID, GeoPackage
Some of our references:
BITEP industrial park
M9 road
Vegetation index
- NDVI, or multispectral mapping
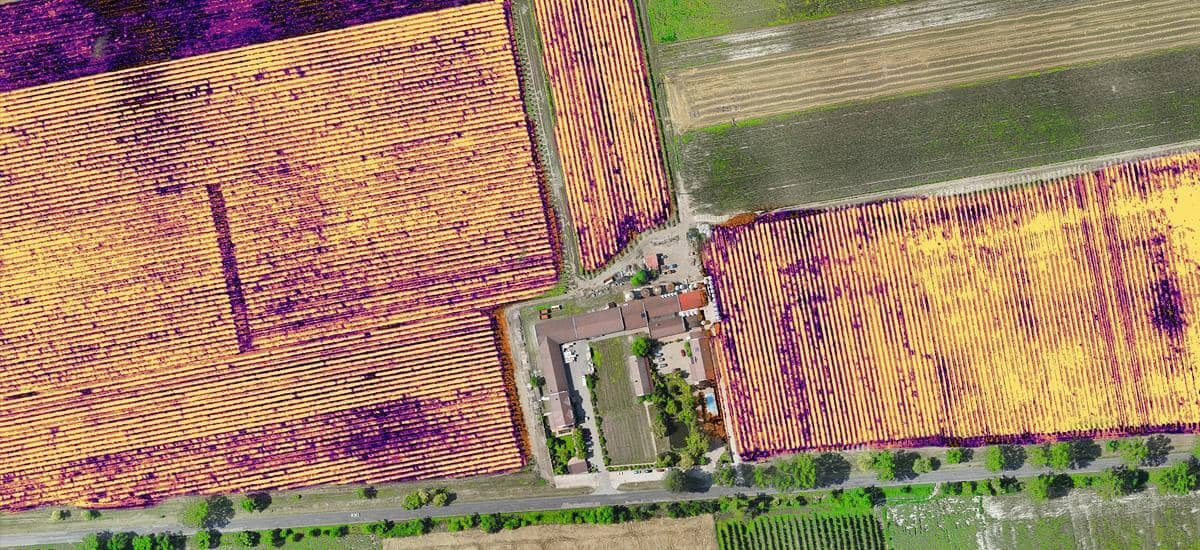
Continuous monitoring of vegetation intensity is an essential need of precision agriculture. The condition of crops can be made visible to the human eye by multispectral images and derived vegetation indices.
The vegetation index is a dimensionless measure of the vegetation activity of a given area. The vegetation index provides an effective overview of the condition of farmland, crops and forests.
It is recorded with a special multispectral camera and a quantity called NDVI is calculated. The sensor is able to detect and display variations that are not visible to the naked eye. In addition, the images provide cm-precise location data (geolocation) of the areas.
The vegetation index makes it possible to easily identify any area requiring intervention from the evaluated inventory.
Without being exhaustive, we can define overwatered/dry areas, infested plants, nutrient deficient plants, etc.
Its use is not only efficient but also a cost-effective solution:
locate the infested areas of a field, allowing you to spray only the affected parts instead of the whole field. In addition to protecting the environment, the technology saves a lot of man-hours, chemicals or nutrients, energy and money.
Possible outputs:
GEOTIFF, GEOJPG, ECV, MRSID, GeoPackage
Some of our references:
BITEP industrial park
Budaörs Hegyalja út
Bodri winery
Koch winery
Egri wine region

Digital River Basin or Lakebed Model
- important information from underwater
In still and flowing waters, we create a surface model of the river bed using an unmanned surface vehicle („drone boat“) and a sonar attached to it.
The resulting surface model and/or contour map provides accurate information about the current state of the riverbed, which forms the basis for hydraulic calculations and modelling.
In addition, we can model seasonal changes and, during underwater mine excavations, we can model and measure the amount of excavated material by comparing the periodically generated bed models.
Its usefulness lies in its uniqueness. It is the only effective method for producing a surface model of underwater surfaces.
With the help of a digital basin model, you can cost-effectively plan and monitor underwater works such as bridge construction, dredging or harbour maintenance.
Possible output data:
GEOTIFF, ASCII, XYZ, CSV, GeoPackage
Some of our references:
Tagi mine pond
Paks bridge - Great Danube embankment
Lake Venice
Győr - Danube branch of Mosoni
Implementation/Realization map
- to show planned vs. built discrepancies
The implementation map is a document that compares the planned construction with the actual built situation with pinpoint accuracy.
Why it is useful?
It helps us to locate any "discrepancy" that has occurred during implementation compared to the planned condition. An exact comparison of the completed structures with the plans provide useful information, so that almost all minor discrepancies can be detected.
When recording a construction map, an accurate 3D survey, vectorisation and documentation of the completed work is also provided.
Possible output data:
DWG, GeoPackage
Some of our references:
Road 63
Road M1
M30 road
M35 road
M4 road
M44 road
M76 road
M8 road
M83 road
M9 road
M85 road
M85 road Archaeological excavation
R67 road
Construction monitoring
- always up to date
Transparency and traceability are critical in any construction project, especially when it is large-scale and/or long-term.
This is what construction monitoring, based on aerial surveys, provides.
Thanks to our service, we are able to display the various documents (e.g. construction plans, orthophotos, cadastral maps, zoning plans, regulatory plans, utility plans, etc.) on a single platform, allowing you to monitor the progress of construction works.
Regular recording not only provides an effective solution for tracking the progress of the construction works, but also produces highly accurate, high-resolution input data for the increasingly popular Building Information Modelling (BIM) systems.
Using our in-house imagery, and our proprietary automated processing software and algorithms, we can quickly generate valuable construction progress data to provide reliable and accurate background data for construction accounting.
Our potential output data:
LAS, LAZ, DWG, DXF, DGN, SHP, GEOTIFF, GEOJPG, ECV, MRSID, GEOTIFF, ASCII, XYZ, CSV, GeoPackage
Some of our references:
M30 road
M35 road
M30 road
M35 road
M4 road
M4 road
M8 road
M85 road
R67 road
Clearance assessment
- to identify any dead spots
A clearance survey provides effective, tangible assistance in the planning process.
In the design of drone surveillance systems, "line-of-sight" assessment between repeater stations and deployment of security (camera) systems, blind spot free coverage between critical points is essential.
By knowing the areas of concealment, the study will clearly point out the areas that are critical for the "overall visibility" of the systems to be installed.
For objects in operation (e.g.: manufacturing plants, industrial sites, building complexes), the security system in use can be checked. By carrying out a clearance test, it can be verified whether the system does indeed cover all the hazardous areas and, if not, it can be clearly seen where and by what intervention the areas and dead spots can be eliminated.
Possible output data:
geotiff, GeoJPG, ECV, MRSID, GeoPackage
Some of our references:
Bosch- Industrial Park
Shipyard Island
Animation Video- and Film library
Perfect video animated presentation of the planned facility in preparation for the investment, with a perfect survey and representation of the real environment. The level of detail and thoroughness of the modelling depends only on the client‘s need.
Our animated videos, produced as part of construction monitoring during construction, provide a comprehensive and visual representation of the progress over time.
We also produce full, comprehensive animations showing the progress of the project once it is completed.
Our film cadastre of geo-referenced, scale-accurate files allows us to identify and equip filming locations so that our Clients can prepare and tailor filming locations most efficiently, even from a distance.
Our possible output data:
AVI, MP4, MOV
Some of our references:
M44 Tiszakürt - Kondoros construction progress
M85 Csorna - border design, construction presentation
M85 animation showing the state of completion
Animation showing the progress of the Várpalota bypass section of the 8th motorway
M4 Berettyóújfalu - border section under construction animation